Date Published 12 September 2016
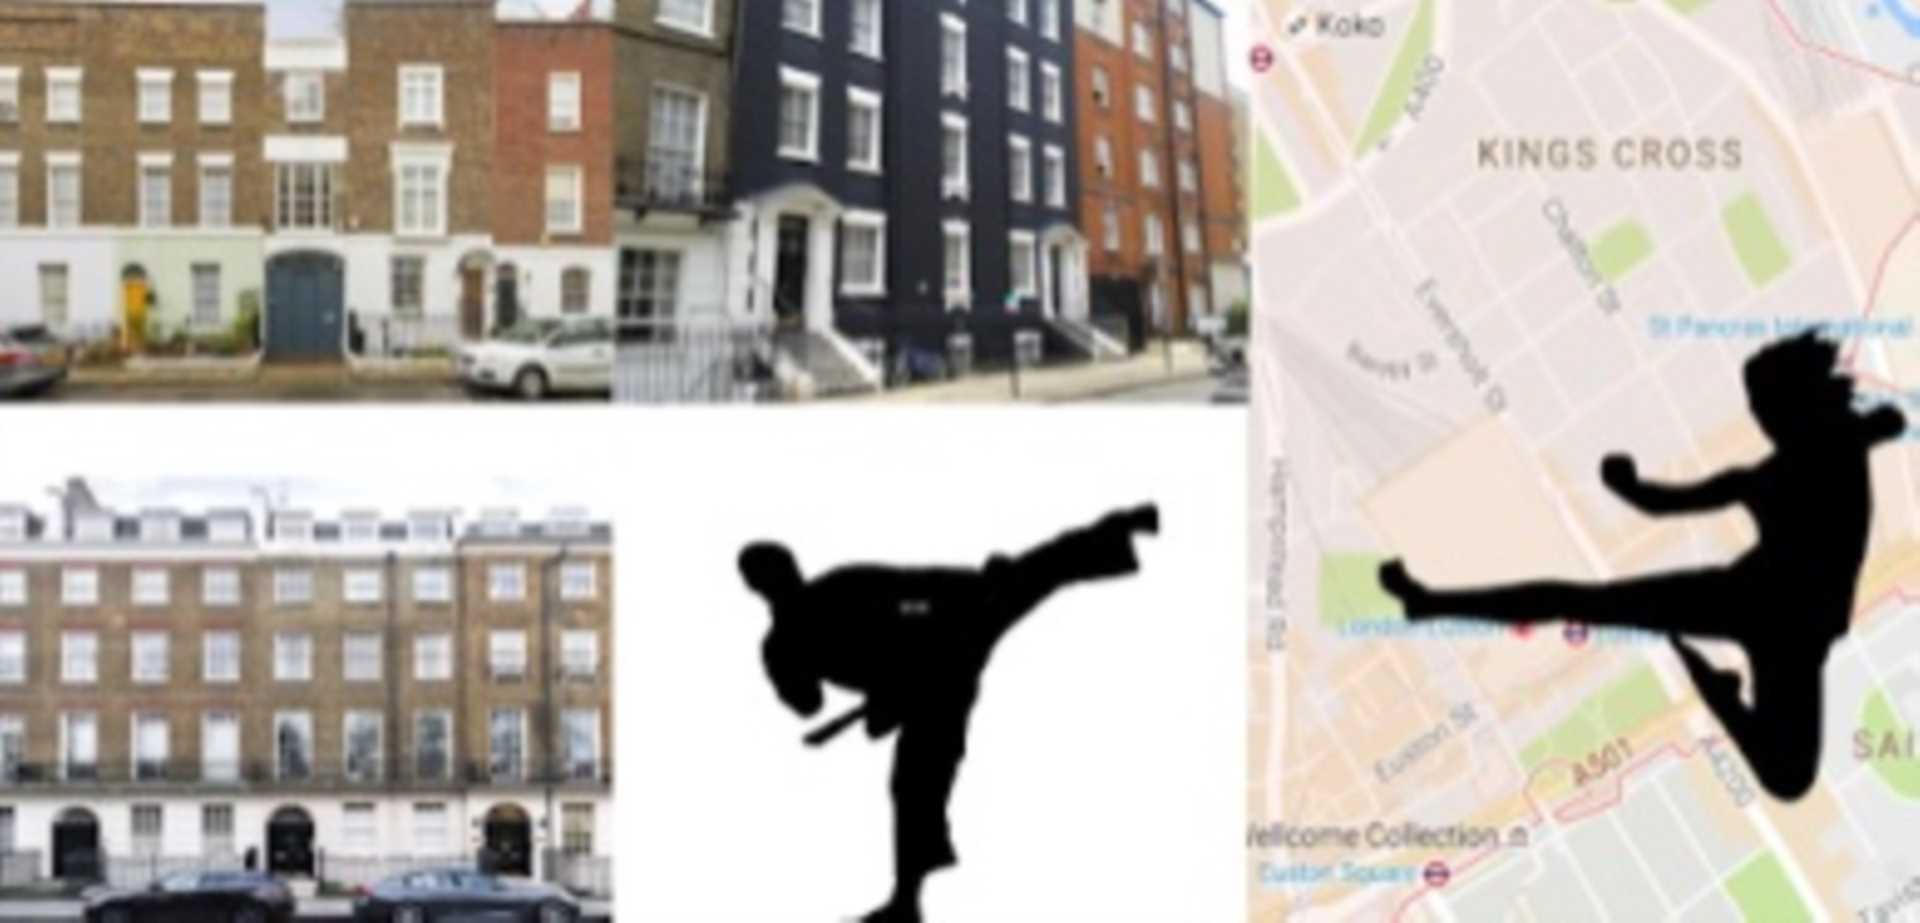
We don't have to travel far from last week's properties, as we are going to be focussing on Marylebone's NW1 once again, but the will of the people has been decided - and for this week our challenger is going to be King's Cross; another influential NW1 sector of the property market. I've seen many of my existing clients - as well as some new faces, express an even greater deal of interest towards Marylebone's NW1 than I usually receive for this particular perimeter. An increasing number of investors are beginning to view NW1 as a cheaper alternative to some of the more costly Marylebone postcodes such as W1G along with W1U, and would like to witness the area's capabilities even further. One noteworthy request which I received derived from a new up and coming investor, he was very impressed by how Marylebone performed against Regent's Park as well as Camden Town last week, and was really intrigued whether the area could resist King's Cross' investment rivalry as well – also a member of the NW1 stronghold. As I established in my preceding article, Marylebone with its prime location and prestigious reputation has been on the rise in the property market for a good while now and there isn't much indication that this will change anytime soon; overall sold prices in Marylebone over the last year were up by 27% against the previous year and increased by 34% since 2013. Marylebone's NW1 sector contributed significantly to these figures, with a good proportion of sales concentrated within this perimeter; this has been boosted by luxury new builds from Galliard Homes - such as Jerome House, a showcase of luxury living offering 25 exclusive apartments set over 7 floors. In addition, as well as it's impressive history with residents such as Charles Dickens once gracing the Marylebone pavements, there has been an ever-increasing list of contemporary celebrities found visiting, as well as dining in the nearby area on a more frequent basis – which has only helped to increase the profile of the area and systematically it's investment potential too. Now to our new competitor, located eastwards from Marylebone's NW1, King's Cross has become a very well-known London perimeter, with an exciting cultural scene and a thriving business community; it looks to have left its traditionally seedy reputation well and truly behind it. The investment prospects of King's Cross has significantly improved with its regeneration in the mid 1990's and the influential introduction of its Eurostar rail service terminus, which opened at St Pancras International in 2007. The Construction of King's Cross Central was also a key part of the newfound success in the property market, with this previously underused 67 acre site being transformed into a new part of London's city - with homes, shops, eateries, offices and educational establishments. Since these initial redevelopment plans, with the planning permission being granted in 2006, there has been 50 new buildings, 1,900 new homes, 20 fresh streets, 10 new public parks/squares, and an expected 30,000 more local people to inhabit the area by the end of 2016; King's Cross has become one of the new attractive places to live, work and stopover in London. Well returning to our objective, in order to study the investment prospects of these two areas against one another, I will start by checking out a host of different streets within both Marylebone's and King's Cross' NW1 perimeters – analysing the 2 and 3 bedroom properties which are situated here. I will be using three representative streets for each location, where I will be collecting a range of financial information such as: the average values of these types of properties along each street along with their average rental values, the predicted rental yields a buy-to-let investment would bring, as well as the recorded capital growth levels of the last 10 years.
Investment analysis of 2 and 3 bedroom properties within Marylebone's NW1 neighbourhood vs. King's Cross' NW1 area:
Marylebone (NW1):
Linhope Street (NW1 6ES, NW1 6HL, NW1 6HT):
2 bedroom properties: Average Property Value: £967,000 – Average Rental Value: £3,600 (pcm) – Predicted Rental Yield= 4.46% - Average Purchase Price in 2006: £415,000 – Capital Growth over the last 10 years (2006 – 2016) = 85%
3 bedroom properties: Average Property Value: £1,670,500 – Average Rental Value: £5,200 (pcm) – Predicted Rental Yield= 3.73% - Average Purchase Price in 2006: £655,000 – Capital Growth over the last 10 years (2006 – 2016) = 94%
Balcombe Street (NW1 6HD, NW1 6ND, NW1 6HE):
2 bedroom properties: Average Property Value: £1,112,430 – Average Rental Value: £4,000 (pcm) – Predicted Rental Yield= 4.31% - Average Purchase Price in 2006: £480,000 – Capital Growth over the last 10 years (2006 – 2016) = 84%
3 bedroom properties: Average Property Value: £1,495,969 – Average Rental Value: £5,300 (pcm) – Predicted Rental Yield= 4.25% - Average Purchase Price in 2006: £610,000 – Capital Growth over the last 10 years (2006 – 2016) = 90%
Dorset Square (NW1 6QN, NW1 6EP, NW1 6PU):
2 bedroom properties: Average Property Value: £996,883 – Average Rental Value: £3,500 (pcm) – Predicted Rental Yield= 4.21% - Average Purchase Price in 2006: £420,000 – Capital Growth over the last 10 years (2006 – 2016) = 87%
3 bedroom properties: Average Property Value: £1,706,200 – Average Rental Value: £5,900 (pcm) – Predicted Rental Yield= 4.14% - Average Purchase Price in 2006: £690,000 – Capital Growth over the last 10 years (2006 – 2016) = 91%
King's Cross (NW1):
Medburn Street (NW1 1RJ, NW1 1RH):
2 bedroom properties: Average Property Value: £728,300 – Average Rental Value: £2,600 (pcm) – Predicted Rental Yield= 4.28% - Average Purchase Price in 2006: £310,000 – Capital Growth over the last 10 years (2006 – 2016) = 86%
3 bedroom properties: Average Property Value: £1,205,428 – Average Rental Value: £3,700 (pcm) – Predicted Rental Yield= 3.68% - Average Purchase Price in 2006: £474,000 – Capital Growth over the last 10 years (2006 – 2016) = 94%
Penryn Street (NW1 IRL):
2 bedroom properties: Average Property Value: £734,000 – Average Rental Value: £2,550 (pcm) – Predicted Rental Yield= 4.16% - Average Purchase Price in 2006: £321,000 – Capital Growth over the last 10 years (2006 – 2016) = 83%
3 bedroom properties: Average Property Value: £1,232,500 – Average Rental Value: £3,800 (pcm) – Predicted Rental Yield= 3.69% - Average Purchase Price in 2006: £525,000 – Capital Growth over the last 10 years (2006 – 2016) = 86%
Goldington Street (NW1 1UE, NW1 1UG):
2 bedroom properties: Average Property Value: £709,485 – Average Rental Value: £2,450 (pcm) – Predicted Rental Yield= 4.14% - Average Purchase Price in 2006: £318,000 – Capital Growth over the last 10 years (2006 – 2016) = 81%
3 bedroom properties: Average Property Value: £1,140,200 – Average Rental Value: £3,450 (pcm) – Predicted Rental Yield= 3.63% - Average Purchase Price in 2006: £490,000 – Capital Growth over the last 10 years (2006 – 2016) = 85%
As we can see from our gathered data, both Marylebone and King's Cross provide us with a healthy and very much investable outlook for their NW1 perimeters; but let's begin to unravel some of these results and see which area comes out on top! Firstly on the subject of property values, the average findings for Marylebone (NW1) approximate to an average value of £1,025,437 for 2 bedroom homes and £1,624,223 for the larger 3 bedrooms. Conversely, King's Cross' NW1 sector provides us with a much cheaper to-buy stance, with both their 2 and 3 bedroom properties being significantly cheaper: 2 bedroom properties arrive at an average worth of £723,928, whereas 3 bedroom residences, although naturally higher, still fall significantly short of the Marylebone prices at an average of £1,192,709. Regarding the rental figures, with Marylebone (NW1), if we calculate the average rental tag of our selected pool of 2 bedroom residences, we get a value of £3,700 (pcm) - with Balcombe Street portraying the priciest homes; as for 3 bedroom properties, the average rental price stands at a much higher £5,466 (pcm), and Dorset Square can be recognised as the most expensive street. If we compare these findings to King's Cross (NW1), yet again there is a significant gulf in the finances involved, where 2 bedroom properties here expect £2,533 (pcm) on average – a hefty £1,167 (pcm) less than Marylebone; 3 bedroom households also advertise considerably cheaper prices in the region of £3,650 (pcm) – a whopping difference of £1,816 (pcm) compared to their rival Marylebone. The buy-to-let prospects here clearly favour Marylebone, in respect to 2 as well as 3 bedroom properties, with significantly more income up for grabs in this area with the larger rental averages, rather than with King's Cross, which displays less financial potential in this field. This positive buy-to-let trend continues with our predicted rental yields for Marylebone, where a very high average of 4.32% can be expected per year for 2 bedroom homes, whilst 3 bedroom properties also produce a commendable average of 4.04%. Conversely, even though King's Cross (NW1) shows some notable rental yield statistics, nonetheless a reoccurring 2nd place performance is displayed, as their 2 bedroom average comes to 4.19%, and their 3 bedrooms are distinguishably less efficient with a median 3.66%. To analyse our final investment indicator, the capital growth rates of Marylebone's NW1 radius were very promising where in the last 10 years, 2 bedroom properties residing here experienced an average growth rate of 85.33% and this was even higher with 3 bedrooms at a growth of 91.66%. King's Cross (NW1) slightly bridges the gap in this department, where 2 bedroom residences underwent a minutely lower 83.33% capital growth, and this is the case again with the 3 bedrooms, where a slightly inferior 88.33% capital growth rate was recorded in the past 10 years. Summing up our results, Marylebone on the whole seem to come out very much on top, beating King's Cross at almost every turn. Whilst King's Cross (NW1) encompasses significantly more cost-effective properties when it comes to their valuations, Marylebone clearly has what we desire – a better investment potential, where this area rakes in an all round better rental income, generates greater rental yields, and displays a more successful capital growth rate.
Last but not least, if you have one, two or even several more questions to be answered about the NW1 property market in general, or if you want a more focussed look at either Marylebone or King's Cross, please get in touch with me - I'd be delighted to hear from you all. Much of the feedback, as well as the conversations I have with my readers, form an imperative part of my work and provide me with inspiration for new articles; it also aids me in deciding which aspects of the Marylebone property market I should be addressing; so all emails, calls, letters or comments are certainly very welcome!